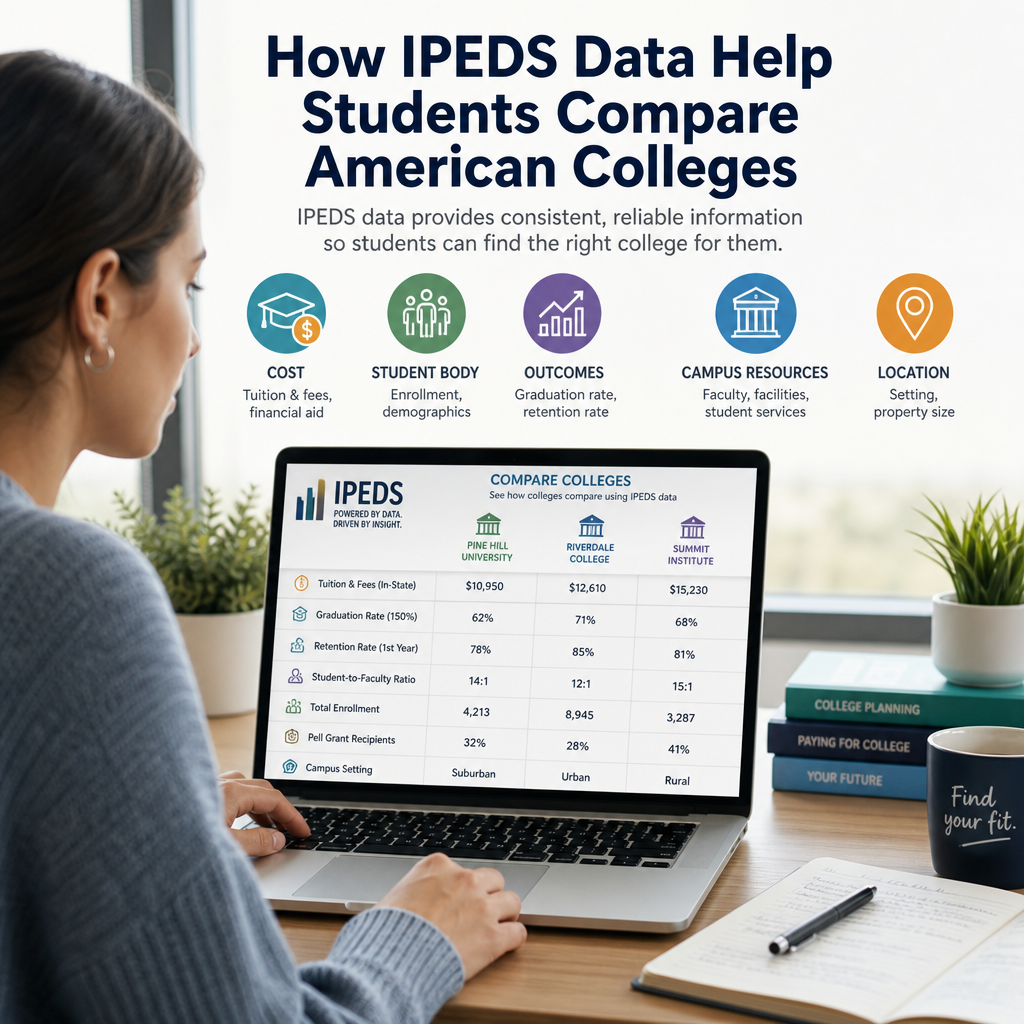
How IPEDS Data Help Students Compare American Colleges
IPEDS data gives students a clearer, apples-to-apples way to compare American colleges on everything from cost and graduation rates to student diversity and campus size. Instead of relying on marketing claims, you can use trusted public information to make a more confident college choice.
By: Jennifer Collins on August 3, 2026
Anúncios
Choosing a college is one of the biggest decisions many students make, and the process can feel overwhelming fast. Tuition, graduation rates, student diversity, program offerings, and campus size all matter, but it’s hard to compare schools fairly when every college market themselves differently. That is where IPEDS data comes in.
IPEDS data help students compare American colleges using a common source of information collected and reported in a consistent format. Instead of relying only on glossy brochures or marketing claims, students can use this public data to see how schools stack up on key factors that affect cost, outcomes, and campus experience.
Anúncios
If you’re trying to narrow down your list of colleges, learning how to use IPEDS can make your search smarter, faster, and more objective.
What Is IPEDS Data?
IPEDS stands for the Integrated Postsecondary Education Data System. It is a federal system managed by the National Center for Education Statistics (NCES), part of the U.S. Department of Education. Colleges and universities that participate in federal student aid programs report data to IPEDS regularly.
Anúncios
This makes IPEDS one of the most widely used sources of official college data in the United States.
What IPEDS includes
IPEDS covers a wide range of institutional information, such as:
Tuition and fees
Enrollment numbers
Graduation and retention rates
Admissions selectivity
Student demographics
Financial aid information
Faculty and staffing data
Program completions
Institutional characteristics
Because the data follow a common reporting system, students can compare schools more consistently than they can by looking at individual college websites alone.
Why IPEDS Data Matter for College Searches
College comparison should go beyond reputation. A school may be well known, but that does not mean it is the best fit for your budget, academic goals, or learning style. IPEDS data help students compare American colleges in a way that is more factual and less influenced by branding.
IPEDS gives you apples-to-apples comparisons
Colleges present information differently. One school may highlight a low tuition rate without mentioning typical aid, while another may showcase graduation success without explaining who graduates and when. IPEDS helps bring those details into a more standardized format.
It supports better decision-making
Using IPEDS can help students answer practical questions like:
How much does this college actually cost?
How many students graduate within six years?
Does the school offer the major I want?
What is the student-to-faculty ratio?
How diverse is the student body?
How many students receive financial aid?
These answers can help students build a college list based on fit, not just name recognition.
It helps families compare value
A college with a higher sticker price may still be more affordable after aid. Another school may have lower tuition but fewer support services or weaker outcomes. IPEDS helps students compare these details side by side so they can better understand value.
How IPEDS Data Help Students Compare American Colleges
IPEDS data help students compare American colleges across several important categories. Below are some of the most useful areas to review during a college search.
Tuition, Fees, and Net Cost
Cost is often the first filter students use when comparing colleges. IPEDS includes published tuition and fee data, along with other financial information that can help students estimate affordability.
What to look at
In-state and out-of-state tuition, if applicable
Required fees
Average net price
Financial aid availability
Estimated attendance costs
Why it matters
The sticker price is only part of the picture. A college with a high published tuition may offer substantial grants and scholarships, which can lower the real cost. IPEDS data help students compare published charges and understand where to dig deeper.
Practical example
If two schools both offer your intended major, but one has a much lower average net price and higher aid participation, that school may be the stronger financial choice even if its tuition list price looks higher at first glance.
Graduation and Retention Rates
Many students want to know whether a college supports students through to completion. IPEDS reports retention and graduation data that can give useful clues about student success.
What to look at
First-year retention rate
Graduation rate for first-time, full-time students
Completion rates for different student groups
Time to degree patterns, when available
Why it matters
A high retention rate may suggest that students feel supported enough to return for a second year. Graduation rates can also show whether students are finishing at that school in a reasonable amount of time. These numbers do not tell the whole story, but they are an important part of the picture.
Helpful context
Not every student follows the same path. Some transfer, attend part time, or take longer to graduate because of work or family obligations. Still, these metrics help students ask better questions about academic support and campus stability.
Enrollment Size and Campus Environment
IPEDS lets students compare colleges by total enrollment and student characteristics. That can be especially useful for students who know whether they want a large university or a smaller, close-knit campus.
What to look at
Total undergraduate enrollment
Full-time versus part-time enrollment
Undergraduate and graduate population balance
Location type and setting
Commuter or residential environment
Why it matters
A student who wants a highly personal learning environment may prefer a smaller school with small classes. Another student may want the energy and opportunities of a larger university. IPEDS data help reveal the scale of a campus before you visit.
Example
A student interested in research opportunities might compare schools with large graduate populations and more faculty. A student looking for a quieter community may focus on smaller colleges with fewer total undergraduates.
Admissions Selectivity
IPEDS also includes information that can help students understand admissions patterns. While this should never be the only factor, it can help applicants build a more realistic list.
What to look at
Acceptance rates
Test score ranges, if reported
Application requirements
Number of applicants versus admitted students
Why it matters
Admissions data help students gauge whether a school is likely to be a reach, match, or likely admit. That can make the application process more strategic and reduce wasted time and money.
Important note
Acceptance rate alone does not equal quality. Some excellent colleges accept a larger share of applicants, while some highly selective schools may not be the best fit for every student. Use admissions data as one part of your research, not the final word.
Student Demographics and Diversity
IPEDS data include detailed information about student populations. For many students, the composition of the campus community plays a major role in choosing a college.
What to look at
Race and ethnicity breakdowns
Gender distribution
Age mix
First-generation or low-income indicators, when available
Residency status and transfer enrollment
Why it matters
Diversity can affect classroom discussion, extracurricular life, peer support, and sense of belonging. Students often want to know whether a campus reflects a range of backgrounds and experiences.
A balanced approach
IPEDS data can show who is enrolled, but they do not fully capture inclusion, climate, or student experience. It helps to combine demographic data with campus visits, student reviews, and conversations with current students.
Academic Programs and Degrees Offered
Students often compare schools based on whether they offer the major or credential they want. IPEDS can help confirm program availability and degree completion patterns.
What to look at
Available majors and fields of study
Certificate, associate, bachelor’s, master’s, and doctoral programs
Degrees awarded by discipline
Program completion counts
Why it matters
If you want to study engineering, nursing, business, or education, you want a college that not only offers the subject but also has enough depth to support students in that field. IPEDS can help you verify that the program exists and see whether the school graduates students in that area.
Useful comparison tip
Compare the number of degrees awarded in your intended major across several schools. A larger number does not always mean better quality, but it can signal a stronger or more established program.
Faculty and Class Environment
IPEDS includes institutional staffing information that can help students estimate the teaching environment.
What to look at
Full-time and part-time faculty counts
Student-to-faculty ratio
Instructional staffing levels
Why it matters
These data can help students think about class size and access to professors. A lower student-to-faculty ratio may suggest more opportunities for direct interaction, though it is not a guarantee of class size.
Practical use
Students who want mentoring, research supervision, or close academic advising may prioritize schools with stronger faculty access. Students who prefer larger lecture settings may not see this as a drawback.
Financial Aid and Affordability
IPEDS provides useful data on financial aid, including the percentage of students receiving aid and the types of aid offered.
What to look at
Percent of students receiving grants or scholarships
Average aid amounts, where reported
Loan participation
Net price by income group
Why it matters
Two colleges with similar tuition can produce very different out-of-pocket costs. Financial aid data help students estimate what they might actually pay after grants and scholarships are considered.
Good habit to develop
Always compare:
Published tuition
Average net price
Typical aid package
Loan burden, if relevant
That combination gives a much clearer picture than tuition alone.
How to Use IPEDS Data in a College Comparison
IPEDS is most helpful when used with a plan. Instead of looking at every possible data point, focus on the categories that matter most to you.
Step 1: Identify your priorities
Make a short list of what matters most, such as:
Cost
Location
Major availability
Campus size
Graduation rate
Student diversity
Class size
Step 2: Compare a small group of colleges
Choose three to six schools that are realistic options. Comparing too many at once can make the process confusing.
Step 3: Use the same data points for each school
For a fair comparison, review the same information for each college, such as:
Tuition and net price
Retention and graduation rates
Enrollment size
Admissions selectivity
Financial aid
Degree offerings
Step 4: Look for patterns, not just single numbers
One data point rarely tells the full story. For example, a school with a lower graduation rate may still be a good fit if it serves a large number of part-time or transfer students. Always consider context.
Step 5: Combine IPEDS with other research
IPEDS is powerful, but it should not be the only tool you use. Add:
Campus tours
Department websites
Student interviews
Net price calculators
Accreditation checks
That combination gives you a more complete view.
Limitations of IPEDS Data
IPEDS is a valuable tool, but it has limits. Students should understand what the data can and cannot tell them.
IPEDS does not show everything
It does not measure:
Campus culture
Classroom quality
Mental health support
Student satisfaction
Internship access
Career outcomes in detail
Personal fit
Some data may lag
Depending on the metric, information may reflect a previous reporting period. That means the numbers are useful, but they may not capture the most recent changes at a college.
Campus experience is more than data
A school can look strong on paper and still feel wrong for a student’s goals or personality. Use IPEDS to narrow the field, then rely on personal research to make the final call.
Best Practices for Using IPEDS Wisely
To get the most out of IPEDS data, keep these tips in mind:
Focus on the metrics that match your goals
Compare similar schools, not just famous ones
Use multiple years of data when possible
Look at trends instead of isolated numbers
Check official college websites for updates
Confirm that programs are accredited if accreditation matters for your field
These habits can help students avoid common mistakes and make more confident decisions.
Frequently Asked Questions
What does IPEDS stand for?
IPEDS stands for Integrated Postsecondary Education Data System. It is the federal data system used to collect and report official information about colleges and universities in the United States.
Are IPEDS data reliable?
Yes, IPEDS data are widely trusted because colleges report them through a standardized federal process. That said, students should still interpret the numbers carefully and use them alongside other research tools.
Can IPEDS help me compare tuition costs?
Yes. IPEDS includes tuition, fees, and net price information that can help students compare affordability across colleges. It is especially useful when paired with each school’s net price calculator.
Does IPEDS show career outcomes after graduation?
Not in a complete way. IPEDS includes some completion data, but it is not the best source for detailed career outcomes or salary information. Students should look at institutional career center pages, alumni outcomes, or other trusted sources for that.
How often is IPEDS updated?
Colleges report data on a regular schedule, but not every metric updates at the same time. Some information may reflect the most recent reporting cycle, while other details may be slightly older. Always check the reporting year for each data point.
IPEDS data give students a clear, reliable way to compare American colleges using facts instead of marketing language. By looking at tuition, net price, graduation rates, enrollment size, financial aid, faculty staffing, and program offerings, students can build a more informed college list and avoid decisions based on guesswork.
The biggest advantage of IPEDS is consistency. Because the data come from a federal reporting system, students can use the same categories to compare schools side by side. That makes it easier to see which colleges are affordable, which offer the right academic programs, and which may provide the learning environment you want.
Still, no dataset can tell you everything about a campus. The smartest approach is to use IPEDS as a foundation, then add campus visits, conversations with current students, and official school resources. When you combine those tools, you get a much better sense of where you will thrive academically, financially, and personally.
Taking the time to compare colleges carefully can pay off for years. Start with the data, trust your priorities, and keep asking good questions.
Jennifer, M.Ed., holds a degree in Higher Education Administration, with
a focus on U.S. college financial aid, admissions policy, and student
support systems. She researches and writes about scholarships, federal
aid programs, and the college planning process to help students and
families make informed, well-supported decisions.